
We know the power of data, so why can’t we make a data-driven decision?
It’s no wonder ‘data-driven decision making’ is high on the checklists of most organisations I talk to. Back in 2008, the Obama campaign used digital technology to win. And everyone took notice of their tactics.
Here, Joe Rospars, who created the new media strategy and built a team around it, gives one example of how their technology and data contributed to campaign impact.
If a registrant was a student, the site would ask where s/he went to school and the state s/he came from. “We’d determine which state was most important for us to win,” said Hughes, “…and assuming that the law says that a full-time student can register we would suggest it.”
Obama and the power of social media, Stanford Graduate School of Business, 2009
Since then, most NGOs are looking at data and encouraging teams to make decisions based on what that data says. As a result, most non-profits have data analysts, many have a CRM to consolidate data and some are well on the way to creating a 360° view of their supporters. Most people now understand the concept of data-driven decision making.
So why can’t we make a data-driven decision?
Everyone agrees that data’s important. But people still seem to struggle when it comes to actually making a data-driven decision. Why? According to an organisation I’m working with (and they’re not alone), there are a few different scenarios that play out.
The most senior person in the room draws on their experience to make the decision.
Set in their ways, teams make decisions how they’ve always been made because it’s safe and comfortable.
People turn to data only when a disagreement arises.
Reading data feels like yet another thing to learn, and people are scared of change especially when it feels like maths. They feel it’s not their job and should be left to the data analysts.
There’s always a rush on, a deadline to meet. Lack of time means checking the data gets pushed back: “We’ll do it next time.”
There are technology and system obstacles, or the right data isn’t being collected.

Image decsription: An iceberg diagram illustrating data usage barriers in projects. The visible tip shows surface-level issues: evaluation only happening at project start/end, focus on vanity metrics like social reach, acknowledging need for data-driven decisions in strategy, but not using data to verify what's working. The middle section reveals observable patterns: no time for data work across strategy, tech implementation or analysis, audience insights unused in project planning, and lessons from previous projects not applied to new ones. The underwater foundation of the iceberg exposes deeper structural issues including decision-making by highest-paid person based on gut feeling, lack of understanding about data benefits and collection processes, no unified data system with data scattered across many locations, and underlying assumptions like 'analysts will handle it,' 'I'm not a numbers person,' 'data is extra work,' relying on experience over testing, questioning the value of data insights, urgency over proper testing, and resistance to learning new approaches.
When people pour all their efforts into a project or campaign only for it not to work, it’s frustrating. Especially if the data points to a possible alternative or a range of alternatives to test, but those recommendations are being ignored. Enthusiasm for the project tanks. Not great, right?
Now we’ve named the issue, what’s the solution?
Embedding data driven decision making
As ever, it comes down to looking at People – Process – Technology.
Technology
First, assess the technology you have in place and the data it’s delivering:
Are you collecting the right data?
Where does it sit?
Are your KPI reports useful and meaningful?
These questions are usually pretty straightforward to answer when we look at a KPI like ‘number of email subscribers’, but less so for those big KPIs like ‘behaviour change’.
If you’re not collecting the data, it’s not in a usable form, or you’re not sure what data to use to measure big concepts, talk to your data, digital and tech people. This is an ideal mix of skills and knowledge that will help you find a solution together.
People
The next bit to look at is People. The organisation I’m working with approached me looking for data literacy training. My first thought was that they were looking for training on how to collect data, how to store it safely and GDPR. Very quickly I realised that they know this stuff, as most organisations do. What we need to work on is a People piece of the puzzle.
This version of data literacy is actually a new way of thinking and being. It’s a new mindset which means that data-driven decision making will challenge old assumptions and behaviours. So what I’m looking at is a way to help people shift from the old way of thinking to this new mindset.
Process
There’s also a big piece on Process in there as well: making sure data-informed thinking is embedded at the beginning, middle and end of a project. That means right from the moment you set your KPIs, thinking about what data to collect and how to access it.
My challenge with this client, then, is to develop training that will shift mindsets. Read on for a snapshot of what I’m proposing. And of course, as this is a pilot project, I’m following my own advice and having started by defining the problem, I will now test an approach, then iterate based on the data (participant feedback).
Becoming data literate
Following interviews with individuals across the organisation, I discovered varying levels of data skills. There are also people with years of incredible expertise and a huge range of opinions on data’s role within the organisation.
The goal is to create an approach to data which builds on this mix of experience, skills and opinions. Ultimately, I want them to walk away with a useful set of considerations, questions, metrics and processes to use in their projects. It’s not about learning to read statistics and understanding exactly how they’re collected, measured and used. It’s about knowing what data can do for our projects and their impact, how to formulate the right question and understand the answer provided by a report.
Because, despite what people fear, you don’t need to be a data analyst to make data-driven decisions. Data skills should exist across an organisation, with varying degrees of ability depending on department and role. This is something you can instil through recruitment and learning and development, like my current client.
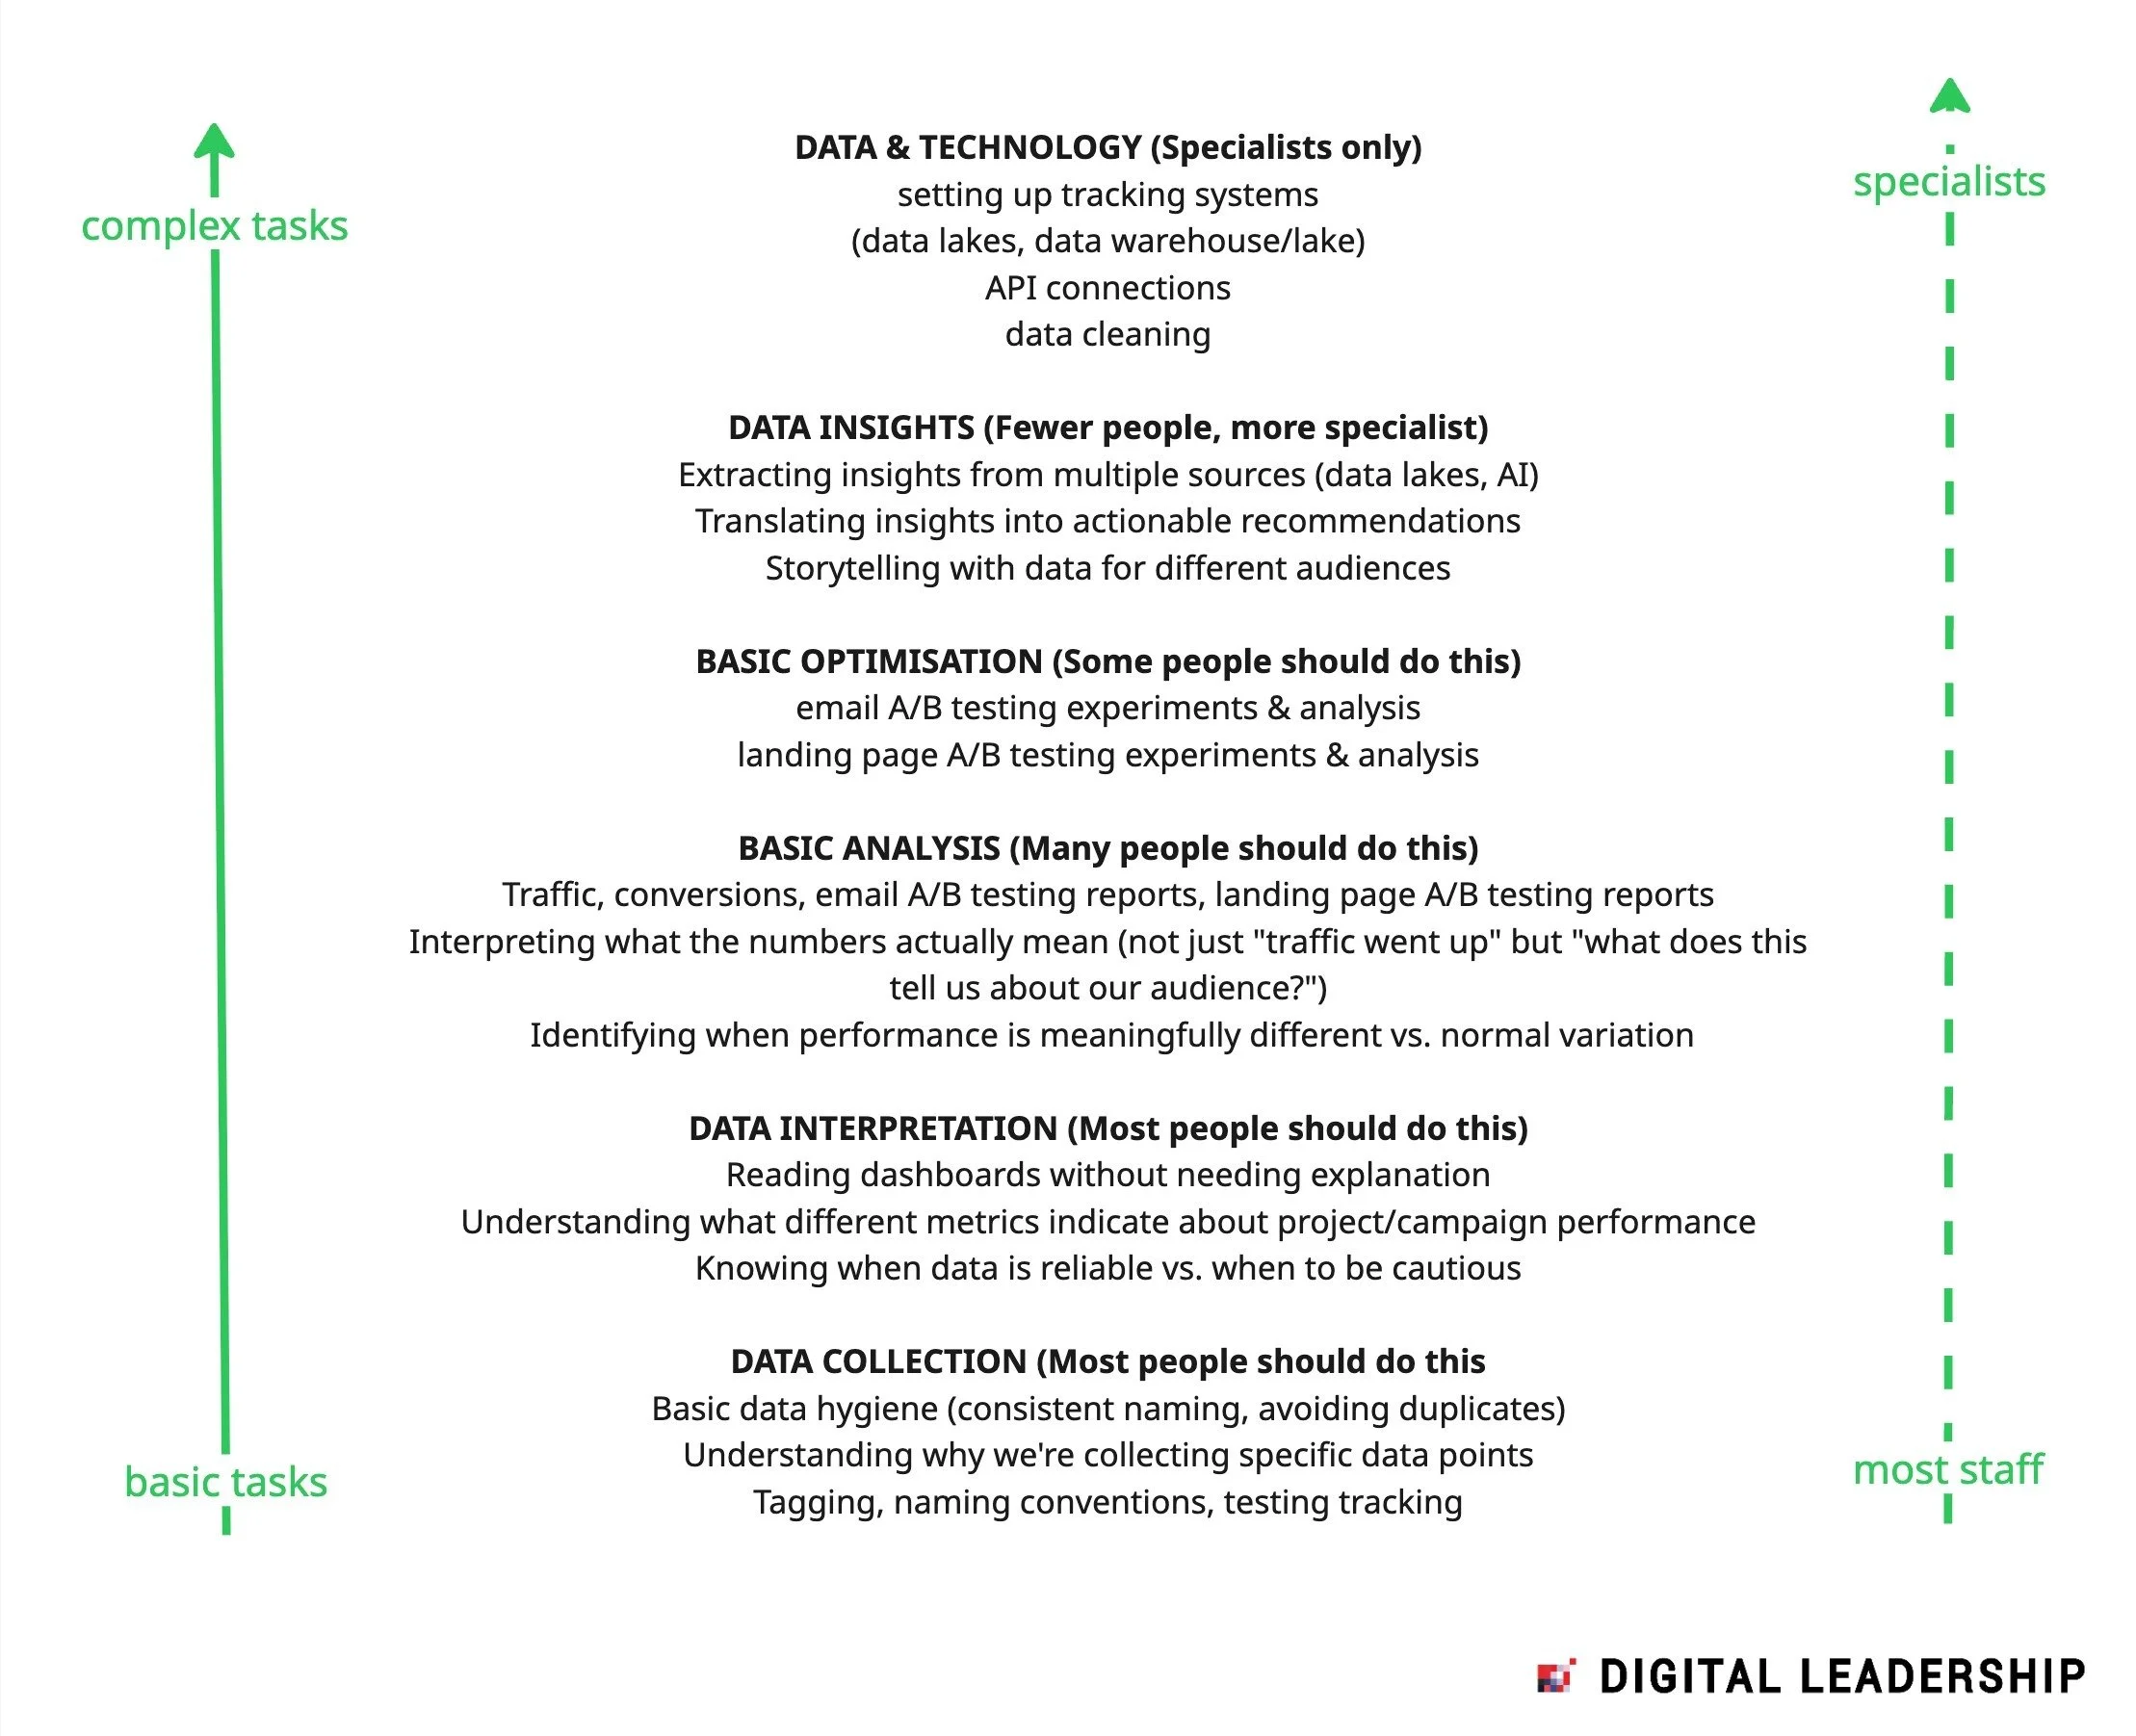
Image description: A hierarchical diagram showing data skills distribution across staff levels. The left axis shows complexity from 'basic tasks' to 'complex tasks,' while the right-axis shows staffing from 'most staff' to 'specialists.' Five levels are defined as follows: 1) DATA COLLECTION (bottom level, most people should do this): basic data hygiene, understanding why specific data points are collected, tagging and naming conventions, testing tracking. 2) DATA INTERPRETATION (most people should do this): reading dashboards independently, understanding what metrics indicate about performance, knowing when data is reliable vs. when to be cautious. 3) BASIC ANALYSIS (many people should do this): traffic and conversion reports, A/B testing analysis, interpreting what numbers mean about audiences, identifying meaningful performance differences vs. normal variation. 4) BASIC OPTIMISATION (some people should do this): email and landing page A/B testing experiments and analysis. 5) DATA INSIGHTS (fewer people, more specialist): extracting insights from multiple sources including AI, translating insights into actionable recommendations, data storytelling for different audiences. 6) DATA & TECHNOLOGY (specialists only, top level): setting up tracking systems, data lakes/warehouses, API connections, data cleaning. Branded with Digital Leadership logo.
The content of the training is shaping up to look something like this:
Making the case: This is the most important part. People have heard data is important but often they haven’t been shown relevant evidence. We’ll explore why data is important, why it works when we use data to plan or adjust our decisions, why it’s helpful. We’ll look at examples from the organisation and beyond, bringing the theory behind data-driven decision making to life.
Basic skillsets: One of the reasons why engaging with data scares people is because they think they need to become a data analyst overnight. We’ll clarify which data skills are for everyone and which are best left to the specialists.
Basic metrics: Learning what basic metrics mean, what they measure and what conclusions they help us make. Again, more than digging into specific metrics it’s about gaining the skillset to understand what questions you can ask, what data provides answers and what to do with the results.
Testing and learning process: By understanding how the testing and learning process works, participants will learn to set a hypothesis and use data to prove or disprove it.

Image description: A flowchart showing an iterative data-driven process. Starting with 'generate ideas (hypothesis),' it flows to 'test your ideas,' then 'collect data' (shown as a green database cylinder), followed by 'analyse data.' A decision diamond asks 'did it work?' If YES, it leads to 'turn lessons into insights for future projects' and then 'celebrate' (with a small flamenco dancer icon). If NO, it goes to 'learn lessons,' then 'try new ideas (hypothesis),' which loops back to another 'did it work?' decision point. This creates a continuous improvement cycle. Branded with Digital Leadership logo.
And while I hope to see great results from one session, it’s more about what happens afterwards: participants going back into their roles and practicing what they’ve learnt. For training to be impactful, it must enable participants to put their understanding into action and make data-driven decisions in their projects and with their teams. So we are also building a support structure around the training to help with this.
If your organisation is facing similar challenges, please do get in touch.

